
Emanuel Cruz
Data Analyst | Reporting & BI Expert

Transforming data into insights to drive smarter decisions and boost efficiency.
With expertise in data profiling, cleaning, and transformation, I automate workflows and deliver impactful visualizations to support strategic decisions. My approach streamlines processes, driving efficiency and empowering businesses with actionable insights.
Featured Projects
Note: While I've completed several projects for companies, they remain confidential and can't be shared here.
SQL | Power BI
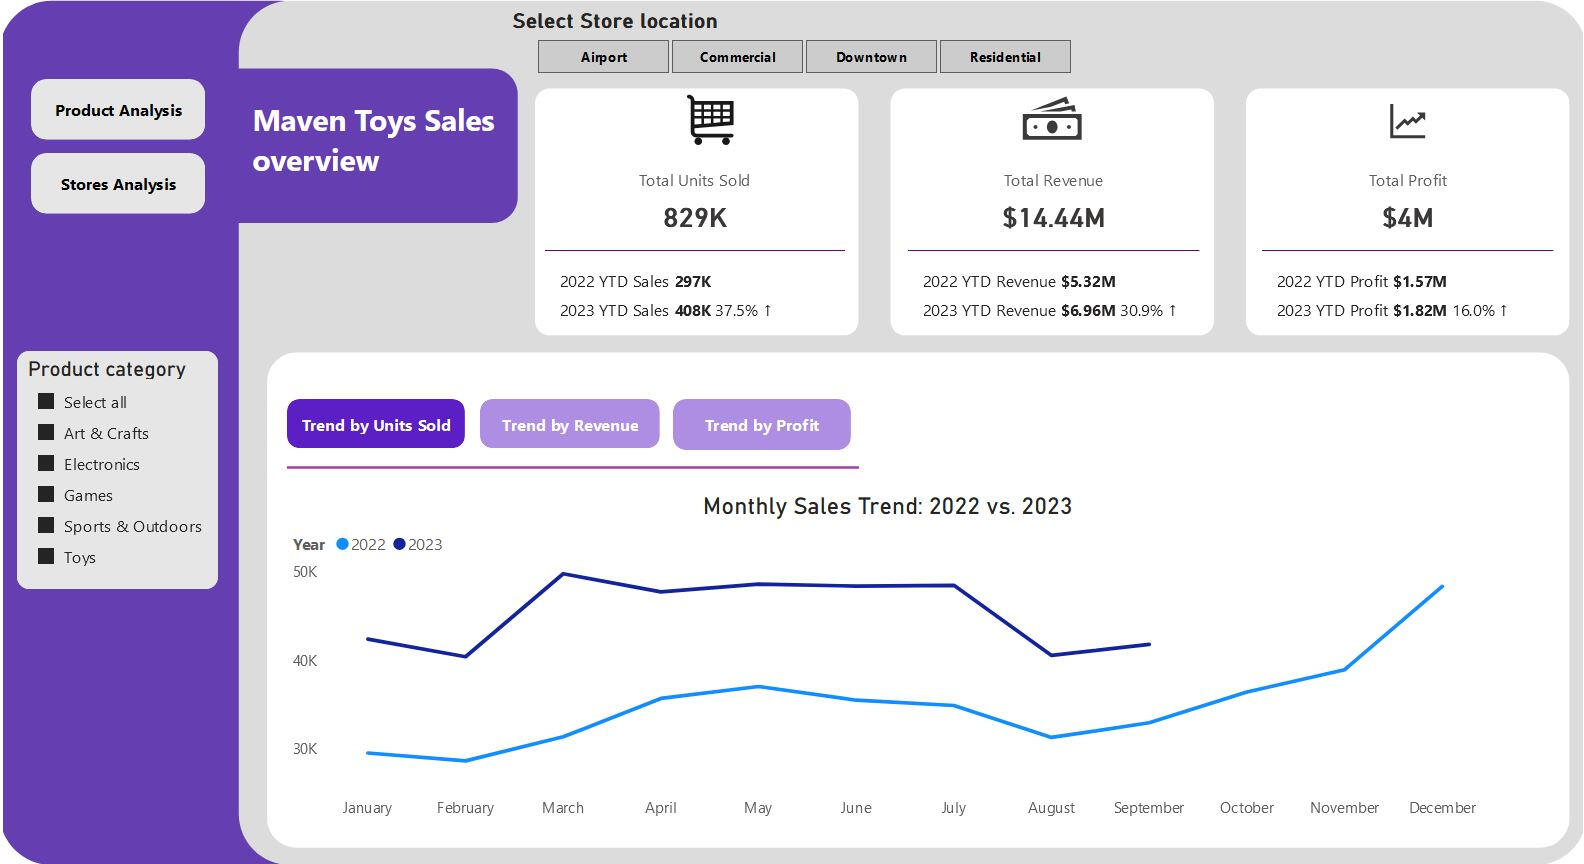
Toys Store Sales Analysis Dashboard
Created an SQL script and Power BI dashboards to analyse and visualize sales evolutions and trends
to support business decision.

Excel
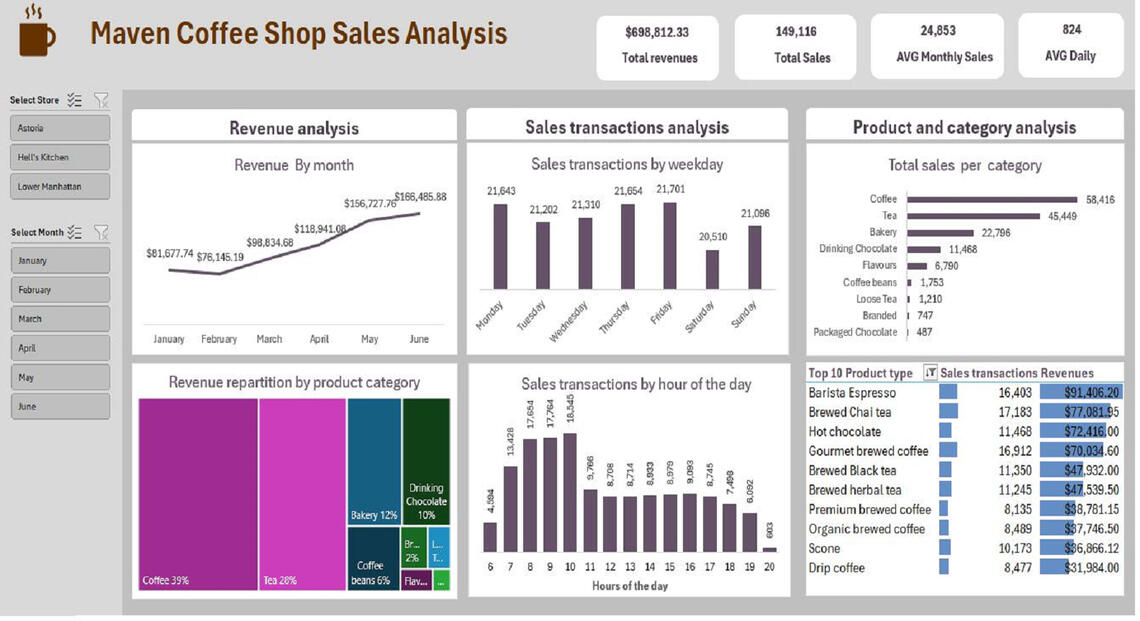
Coffee Shop Sales Analysis Dashboard
Automated the import and cleaning of monthly sales reports using Power Query, then generated a pivot table dashboard to analyze data, uncover trends, and provide actionable insights for business decisions.
Power BI
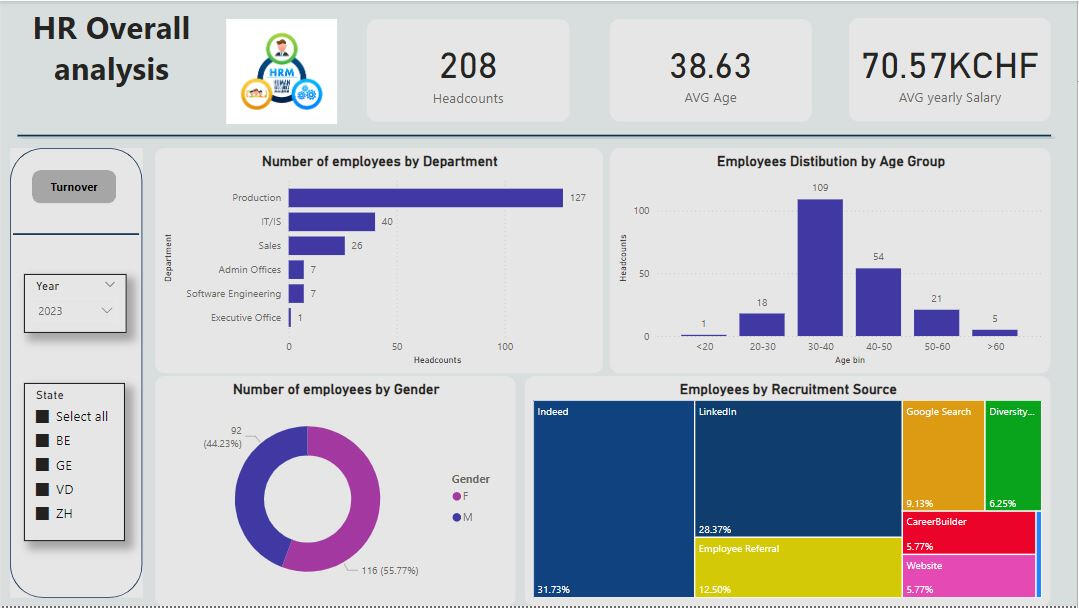
Human Resources Turnover Analysis Dashboard
Developed Power BI dashboards to analyze employee trends over the years and identify key factors influencing turnover rates.
Tableau
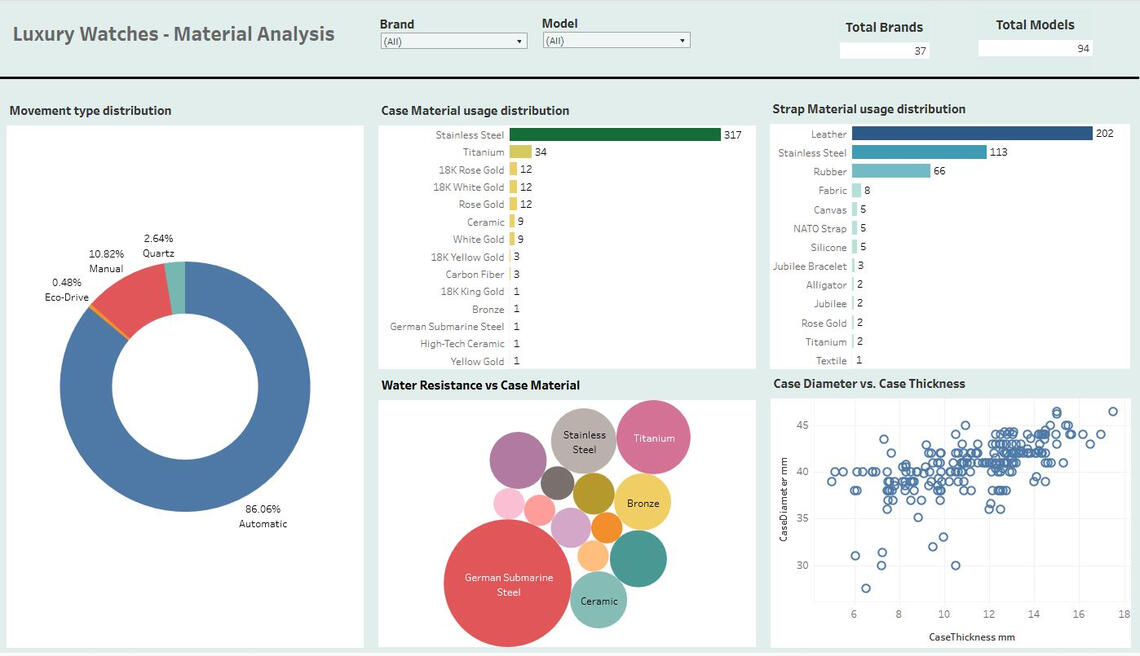
Luxury Watch Materials Analysis Dashboard
Created a Tableau dashboard to analyze materials used in luxury watches, featuring data on models from various brands, including prices, case and strap materials, movement types, and water resistance.
Technical Skills
Excel | Power BI | Tableau | SQL
Data cleaning & Transformation - 10+ years
Data Modeling & Visualization - 5+ years
Report Development - 10+ years
Process improvement & Automation - 10+ years
Professional Certifications
My growing list of proprietary, exam-based certifications.

Microsoft Certified Power BI Data Analyst (PL 300) | Issued in 2024
SQL & Power BI - Toys Store Sales Analysis
Project Overview
This project analyzes sales data from Maven Toys, a fictional toy store chain in Mexico, with data covering product sales, store performance, and inventory levels across multiple locations. The analysis highlights sales trends, profitability, and store performance over 2022 and 2023.Business Questions1. Monthly Sales Trends (2022 vs. 2023):
How do sales trends compare between 2022 and 2023, and what factors contributed to these changes?2. Top-Contributing Categories:
Which product categories drive the most sales and profitability?3. Store Performance:
Which stores are the most and least profitable, and how do their performances differ across various store locations?Data Analysis Tools1. SQLFor this project, to support my analysis, I conducted Initial data exploration using advanced queries to analyze sales performance, product categories, store locations, and inventory data.View SQL Project on my GitHub2. Power BI
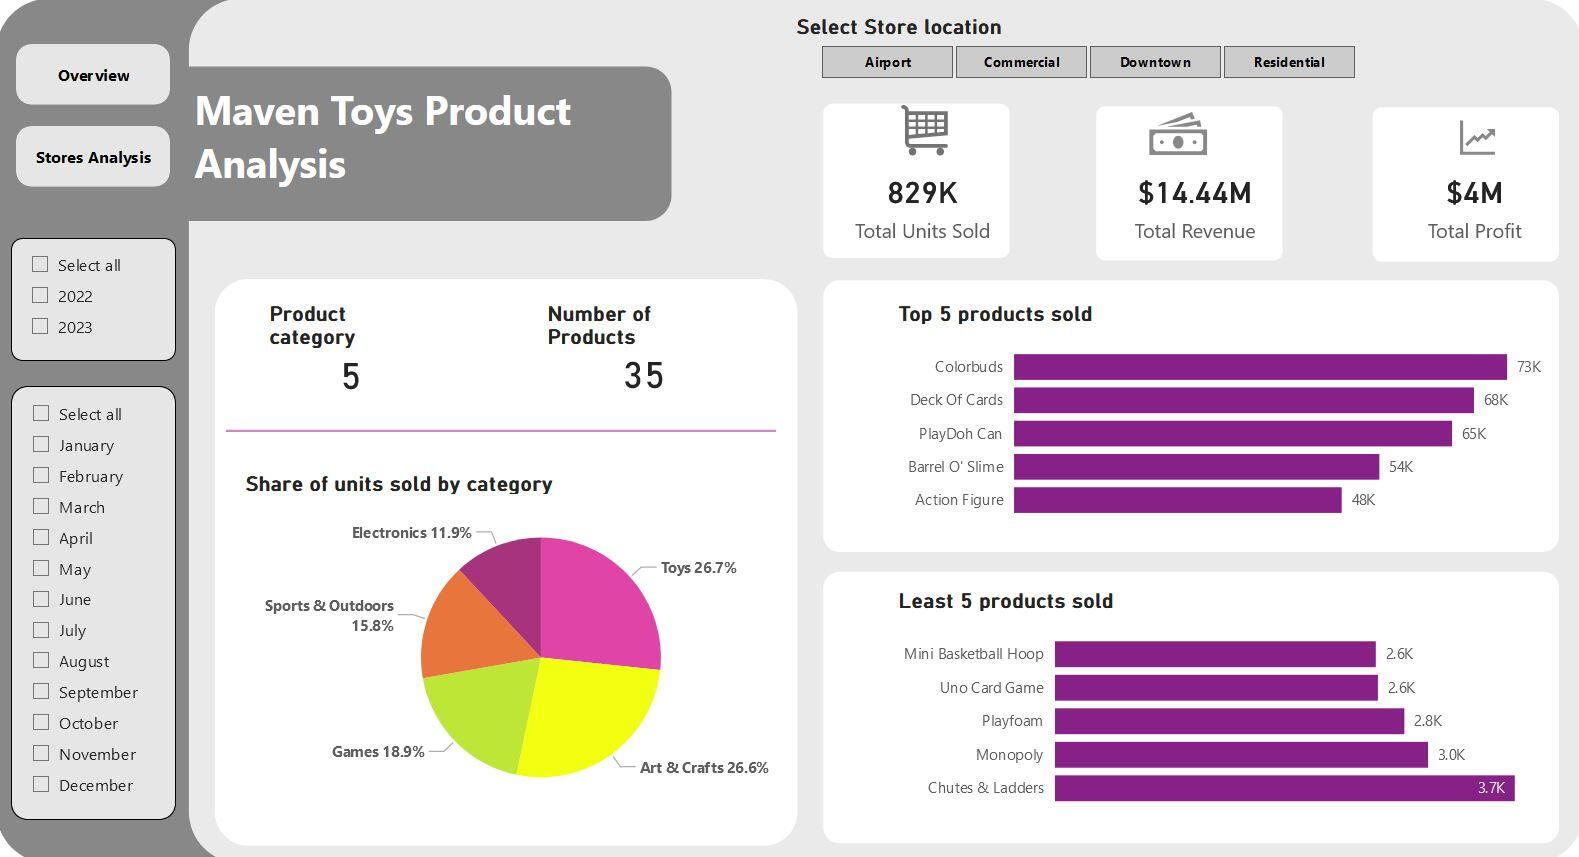
To complement the initial analysis in SQL, I created the following visuals in Power BI Desktop:1. Maven Toys Sales overview
2. Product Analysis
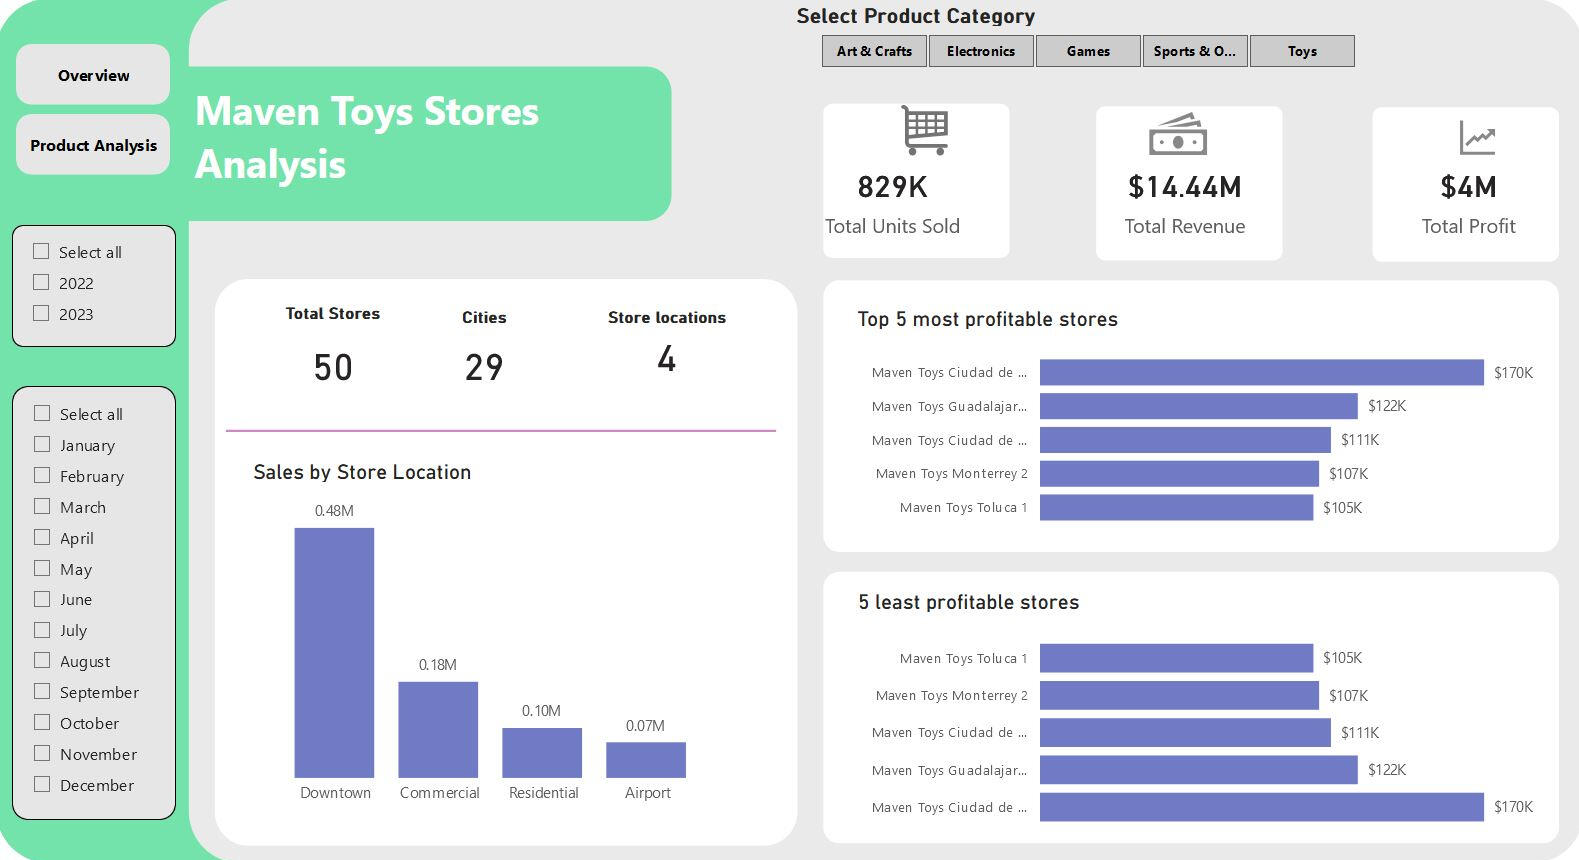
3. Stores Analysis
Power BI tools and techniques• Power Query: Data extraction, transformation, and loading (ETL)• Data Modeling: Establishing relationships between tables• DAX: Custom measures and calendar table creation• Visualizations: Interactive charts, graphs, and dashboardsKey Steps in Power BI1. Data exploration and organization
2. Data transformation and cleaning in Power Query Editor
3. Loading data into Power BI Desktop
4. Creating a Calendar Table using DAX
5. Building relationships between the Fact Table, Dimension Tables, and Calendar Table
6. Developing DAX measures for advanced calculations
7. Designing report visualizations
8. Publishing the project via Power BI ServiceKey Insights1. Sales Overview
• Total Units Sold (2022-2023): 829K units
• Total Revenue (2022-2023): $14.44M
• Total Profit Margin (2022-2023): $4MSales Trends (2022 vs. 2023):While sales and profitability have grown significantly in 2023, the sales trend remains relatively consistent between the two years. The first peak of sales came earlier in 2023 (March) compared to 2022 (May). The strongest sales month in 2023 is expected to be December, driven by holiday shopping.2. Product AnalysisMaven Toys offers 35 products across five categories:
• Art & Crafts
• Electronics
• Games
• Sports & Outdoors
• ToysTop Sellers & Revenue Drivers:• Top Sellers: "Colorbuds" (2022), "Barrel O'Slime" (2023)
• Revenue Driver: Despite higher sales volume for "Colorbuds," "Lego Bricks" consistently generated the highest revenue.3. Store AnalysisMaven Toys operates 50 stores across 29 cities in the following locations:
• Downtown
• Commercial
• Residential
• AirportStore Performance:• Stores in Downtown areas contributed the most to overall sales.
• Ciudad de Mexico 2 emerged as the most profitable store for both years.Recommendations1. Focus on Downtown Stores:
Given the strong sales performance in Downtown locations, investing in these areas may yield higher profitability.2. Product Focus:
Consider increasing inventory for Lego Bricks as it is the top revenue driver, despite not being the highest seller.3. Seasonal Promotions:
Implement targeted promotions in March, as it showed early peak sales in 2023, potentially boosting mid-year revenue.4. Inventory Optimization:
Adjust inventory levels to align with demand trends, particularly for high-selling products like "Colorbuds."
Interactive DashboardFor a more comprehensive review and to interact with the full dashboard, please click the link below:View Maven Toys Sales DashboardsAdditional detailsView Power BI project on my GitHub
Excel | Coffee Shop Data Analysis
Project Overview
This project analyzes transaction data for Maven Roaster, a fictional coffee shop with three NYC locations. The dataset, sourced from Maven Analytics, spans the first half of 2023 and includes transaction timestamps, locations, and product-level details.Tools & Techniques
1. Power Query: Automates data cleaning, transformation, and consolidates multiple files from a folder.
2. Pivot Tables: Summarizes large datasets quickly and efficiently.
3. Data Visualization: Uses pivot charts to display trends, patterns, and insights clearly.Business questions
1. How have sales trended over time?
2. What are the busiest days of the week?
3. What are the busiest hours of the day?
4. Which Product category generate more sales and revenues?
5. Which products generate the most revenue?Key steps
1. Exploring & Organizing Data
2. Importing and transforming the data in Power Query (data profiling, cleaning and transformation)
3. Loading the data into the excel file (consolidated data from multiple files)
4. Data Exploration & Analysis with Pivot Tables, created charts for the Dashboard
5. Creating slicers and syncing all tables together for filtering
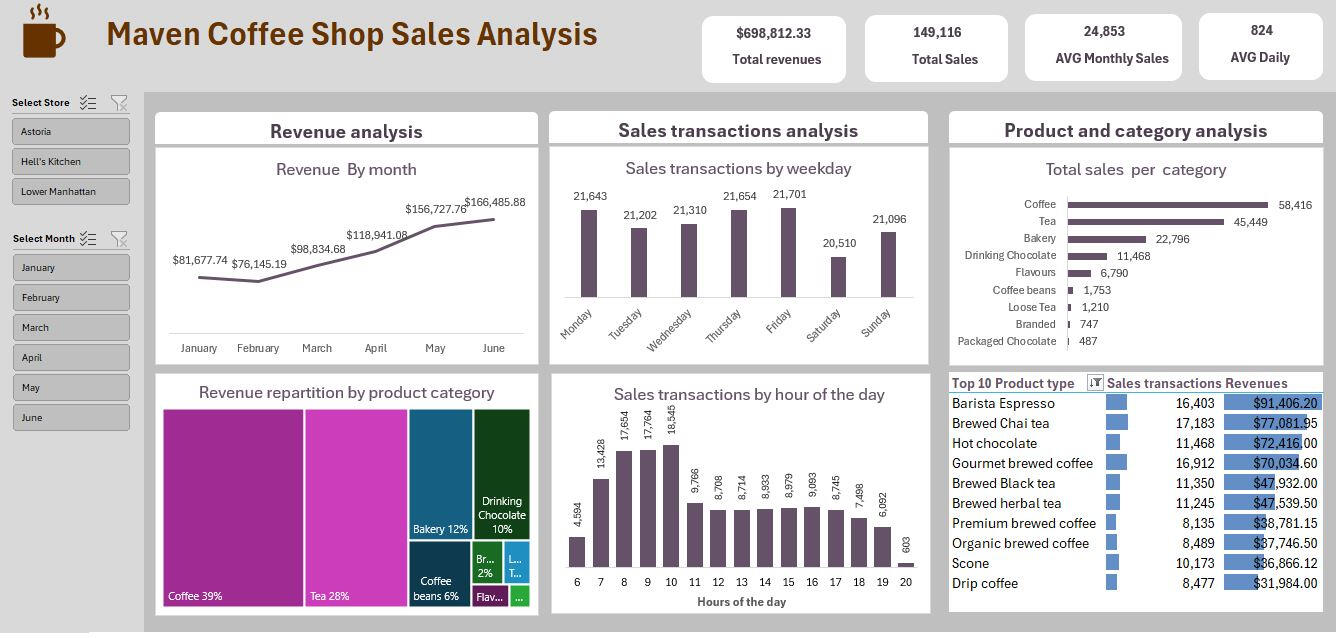
6. Setting up the dashboardFinal Considerations - Insights1. Revenue Growth:
There is a clear upward trend in revenues over the first semester of 2023, with steady growth observed each month.2. Top Revenue - Generating Categories:
• The "Coffee" category is the highest contributor, accounting for 39% of total revenue in the first half of 2023.
• The "Tea" category follows closely, contributing 29% of the total revenue.3. Top-Selling Products:
• The "Barista Espresso" leads as the top revenue-generating product. However, the most popular product in terms of sales volume is the "Brewed Chai Tea," which received the highest number of orders.4. Sales Trends:
• Sales transactions exhibit a similar trend to revenue, with a steady rise over the first semester.
• Mondays, Thursdays, and Fridays show the highest sales activity, though there are monthly fluctuations.
• The busiest hours across all locations are between 8:00 AM and 11:00 AM.5. Store Performance:
• All three store locations are performing relatively well. However, the store in "Lower Manhattan" recorded slightly lower revenue compared to the other two locations.Final considerations - Recommendations:1. Optimize Operating Hours:
Sales transactions drop significantly after 8:00 PM, with particularly low activity between 8:00 PM and 9:00 PM across all stores. For the Lower Manhattan store, this trend begins as early as 7:00 PM.
• Recommendation: Consider closing all stores by 8:00 PM to reduce operational costs and improve profit margins.2. Reinvest in Marketing & Promotions:
Use the resources saved from reducing operating hours to:
• Promote less popular products to increase demand.
• Implement targeted campaigns to attract more customers during off-peak hours, particularly at the Lower Manhattan location from 7:00 PM to 8:00 PM.
Additional detailsFor a more comprehensive review of each steps and interaction with the dataset files and Dashboard, you can visit this project on my GitHub.
Power BI - HR Turnover Analysis
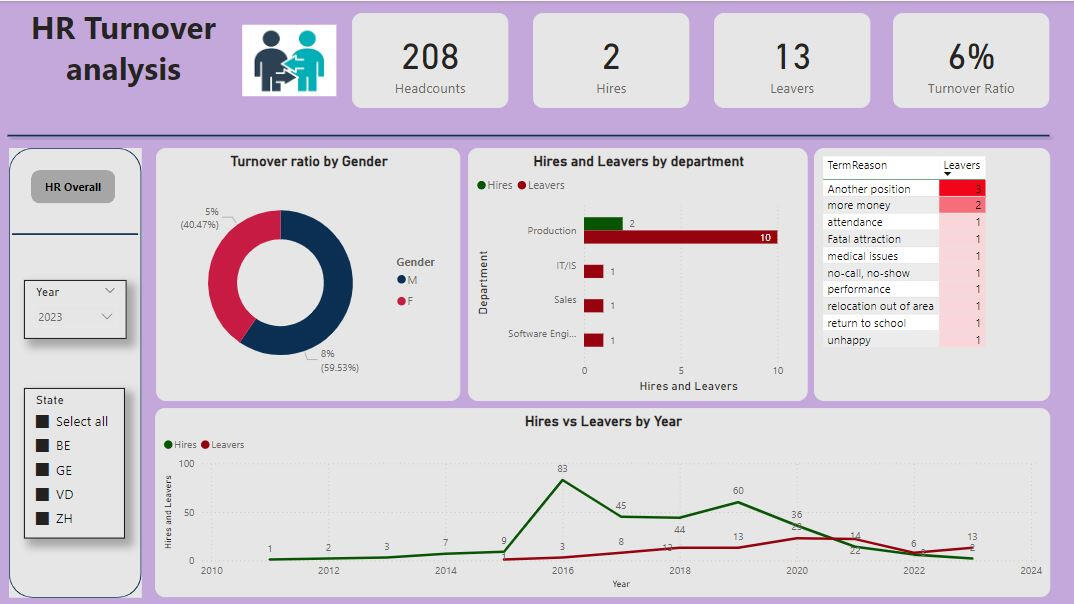
This analysis focuses on HR data for the year 2023. To support this, I created two visualization reports:1. HR Overall Analysis

2. HR Turnover Analysis
Project Overview
This project leverages Power BI to conduct an in-depth analysis of HR turnover trends over multiple years. The analysis offers a comprehensive overview of employee numbers, identifying key patterns and conducting detailed comparisons across gender, age groups, and departments. By providing actionable insights into the underlying causes of turnover, this project supports data-driven decision-making aimed at optimizing hiring practices and minimizing employee attrition.Tools & techniques
1. Power Query (Data Extraction, Transformation, and Loading - ETL)
2. Data Modeling (Relationships and DAX)
3. Visualization (Charts, Graphs, and Dashboards)Business questions
How can the company effectively reduce its employee turnover rate and ensure that critical positions are filled promptly to maintain productivity and morale?
This analysis seeks to identify the root causes of the increasing employee turnover and provide actionable recommendations to mitigate the risk of further staff losses. The goal is to develop a sustainable strategy that improves employee retention and ensures the company's workforce remains adequately staffed to meet operational demands.Key steps
1. Exploring & Organizing Data
2. Importing, cleaning and transforming the data in Power Query Editor
3. Loading the data into Power BI Desktop
4. Creating a calendar Table using DAX
5. Data modelling to establish Relationship between the fact table and the Calendar table
6. Creating several DAX measures
7. Developing report visualizationsFinal Considerations – Key Insights1. Company Overview
• Total Employees: 208 across six departments as of 2023.
• Department Breakdown: Production department holds over half of the workforce, followed by IT.
• Gender Distribution: 55.77% female, showing a balanced but slightly female-skewed workforce.
• Age Distribution: Average age is 38.6, with most employees in the 30-40 age range.
• Recruitment Sources: Indeed and LinkedIn were the top sources for hires, with Indeed leading in 2023.2. HR Turnover Insights
• Turnover Rate: 6% in 2023, with 13 employees leaving and only 2 new hires.
• Department Impact: Production department was hit hardest, losing 10 employees.
• Gender Turnover: Nearly 60% of leavers were male, a notable trend starting in 2021.
• Reasons for Leaving: Main drivers were higher pay and dissatisfaction, highlighting challenges in compensation and engagement.Final considerations - Recommendations1. Employee Retention Strategies:
• Enhance Compensation Packages: Regularly review and adjust salaries and benefits to remain competitive in the market.
• Career Development Opportunities: Implement clear career progression paths and offer training programs to increase job satisfaction and reduce turnover.2. Recruitment and Replacement Efforts:
• Streamline Recruitment Processes: Invest in efficient recruitment technologies and strategies to fill vacant positions more quickly.
• Strengthen Employer Branding: Enhance the company’s reputation as an employer of choice to attract top talent, particularly in departments with high turnover.
Interactive DashboardFor a more comprehensive review and to interact with the full dashboard, please click the link below:View HR Turnover Analysis DashboardsAdditional detailsView Power BI project on my GitHub
Tableau - Luxury Watch Materials Analysis

Project Overview
This project uses Tableau to analyze the materials commonly utilized in the luxury watchmaking industry. The dataset, imported from Kaggle, includes information on 416 watch models from 37 different brands. Key data points such as case materials, strap materials, movement types, and water resistance have been analyzed. This analysis is valuable for departments such as Product Development, Marketing, and Purchase Centers in luxury watch manufacturers, providing insights into material trends and aiding in inventory planning and sourcing decisions.Business questions
1. Which case and strap materials are most commonly used in luxury watches, and how does this vary across different brands?2. What movement types are the most prevalent in luxury watches, and how does this influence material choices for cases and straps?3. Is there a correlation between case material and water resistance in luxury watches?Key steps
1. Data Import: Imported the dataset (in CSV format) into Tableau.Importing, cleaning and transforming the data in Power Query Editor.2. Individual Chart Creation: Created five distinct charts to analyze different aspects of the data.3. Dashboard Creation: Combined all five charts into a cohesive dashboard, formatting and arranging each chart for clarity and ease of interaction.4. Publishing: Published the dashboard on Tableau Public, enabling users to interact with the visualizations and explore the dataset through filters.Final Considerations – Key Insights
1. Movement Type Distribution: The vast majority of watches use automatic movements (86.06%), followed by manual (10.82%) and quartz movements (2.64%).2. Case Material Usage: Stainless steel is the most used case material, followed by titanium and 18K rose gold.3. Strap Material Usage: Leather is the most common strap material, with stainless steel and rubber being the next most popular options.4. Water Resistance: German Submarine steel is the most frequently used material for watches with high water resistance, followed by titanium and stainless steel.5. Case Diameter vs Thickness: There is a clear correlation between case diameter and thickness, where larger case diameters generally have thicker cases.Final Considerations – Recommendations
1. Product Development: Focusing on automatic movements and stainless steel cases could meet customer expectations, but considering alternative materials like titanium may help stand out in the luxury market.2. Marketing Strategy: Since leather straps are popular, marketing efforts can emphasize watches with leather options. Stainless steel and rubber can also be featured in targeted campaigns.3. Purchasing Strategy: Insights on the most used materials, such as stainless steel and German Submarine steel, are valuable for procurement teams to optimize inventory and source the most in-demand materials.For a more comprehensive review and interaction, visit my Tableau public.